Effects of Less Purchasing Power
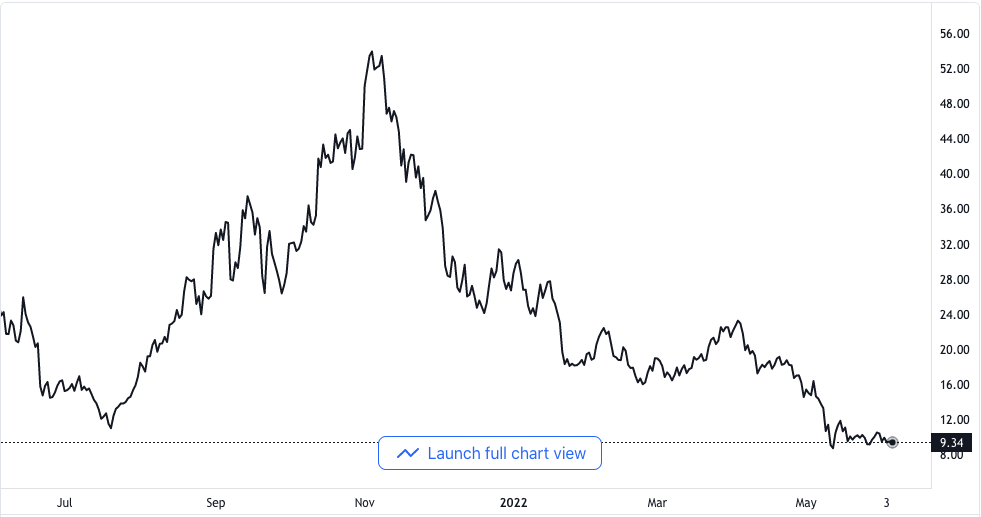
Polkadot has been losing its price value for a couple of days now. Even though it has been trading in the market, the price keeps falling unabated. In the past 24 hours, the token has lost 4.2% of its value.
In the past week also, DOT recorded just minor profits. The weakness in the general market is caused by altcoins trading either downward or sideways. Polkadot snapped under its support level of $14 and it has been dropping sharply since.
Purchasing power has equally declined in the crypto market. It is especially due to the fact that bearish traders took hold of the price action. In spite of the strength, bears have shown, DOT keeps trying to move up.
However, in all its attempts at an advance, Polkadot has encountered stiff selling pressure. Bulls only need to shore up the price to over $9.60 then they might enter the market again. Such a move might introduce relief at the coin’s price.
Polkadot is trading at $9.30 on the day. It is largely consolidating but at the same time, trying to break beyond the level. The purchasing power decline has got the bears stronger in recent times.

A further decline under $9.30 will bring the token to rest at the $8.71 support level. It simply then means that Palkadot would reach the August 2021 price levels.
The overhead support for the alt was $10. An increase over $10 will bring it to trade close to the $11.87 benchmark.
The volume of DOT going around in trade has dropped and is in the red zone. It shows that the bulls have been considerably weakened.
Technical Perspective
DOT recorded a steady increase in its purchasing power as recorded in the relative strength index. The relative strength index has been increasing steadily. At the time of putting this report together, the coin showed a drop in its purchasing power.

There has been a corresponding increased selling pressure around the token since then. The asset’s price was also seen a bit over the 20-period simple moving average. It corresponds to the idea of a price action shift being in motion.
It shows that buyers are gradually picking up momentum. Hence, sellers might not keep driving the price action in the market.
Polkadot gave a purchasing sign which translates to the token showing a likely redirection of price action. MACD shows the price rate and its shows bullishness. It also portrayed green signs which are associated with a purchasing signal.
Bollinger Bands that show price volatility are revealing a narrower band. Once bands are narrow, it’s a sign that price volatility will drop soon.
A drop in price volatility means there would be reduced fluctuation in price. DOT might rise over the resistance if purchasing power increases.


